

Shopify Store A
Shopify · Store Growth · Paid Social Timing
“From a flat line to ₹43.05 L — one month approached ₹15 L.”
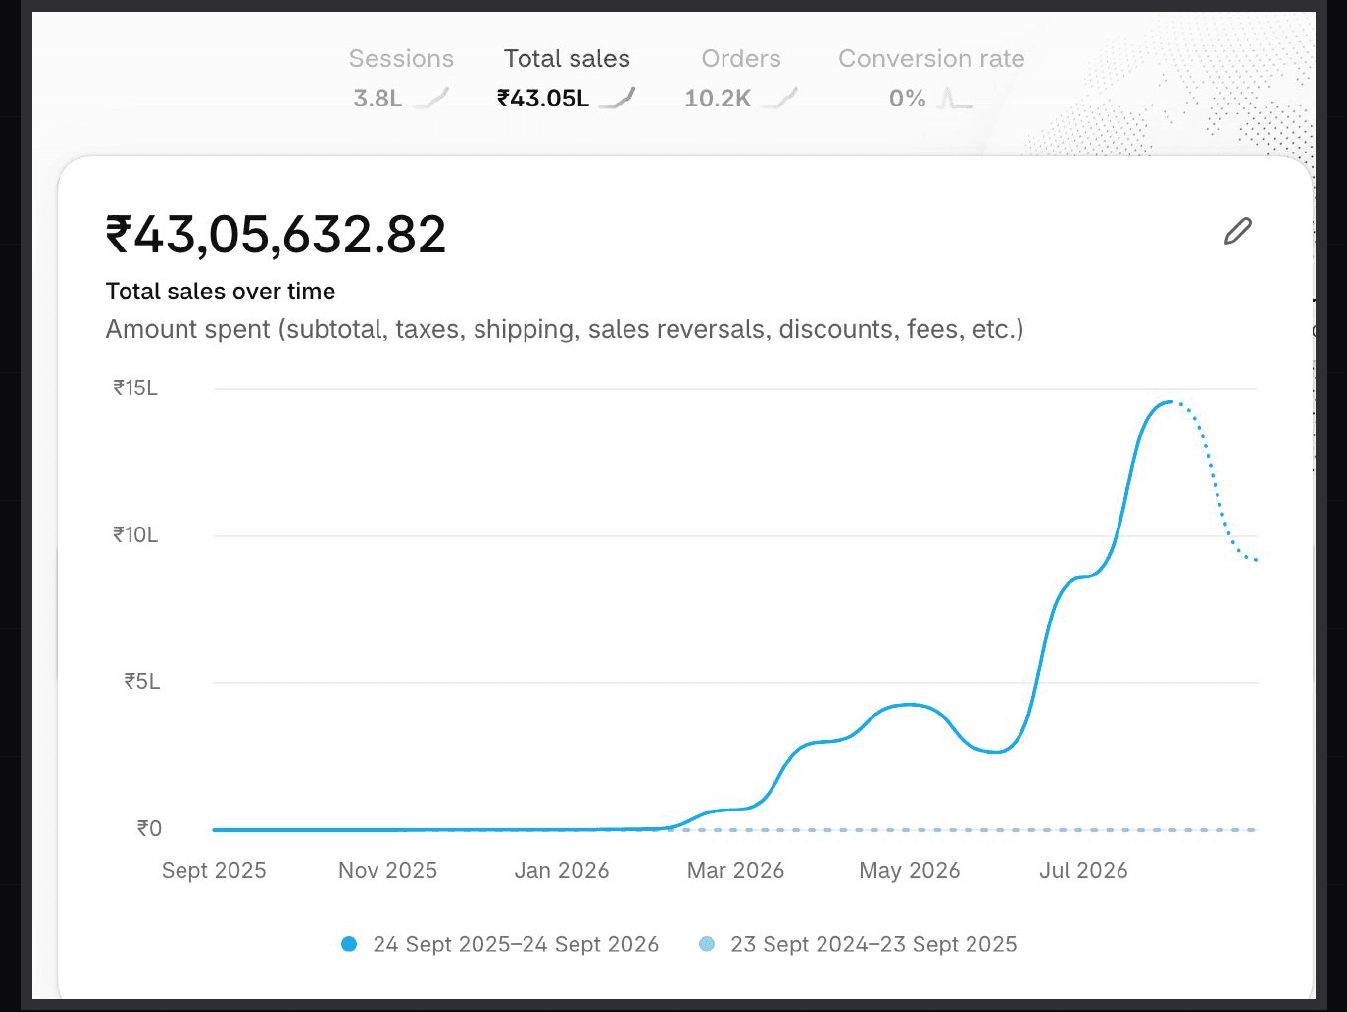
₹43.05 L Total Sales. Moved a Shopify store from a near-flat sales line to a stronger curve after paid social was switched on — ₹43.05 L in sales, 3.8 L sessions and 10.2K orders, with one month approaching ₹15 L.
The Problem
The observable challenge was to move the store beyond a relatively flat sales period and create stronger monthly momentum. The dashboard makes the timing of the change visible, even though it does not explain every action behind it.
How We Solved It
The original record connects the change in the sales curve with the point when the paid-social ad engine was switched on. Monthly revenue stepped up through the summer and approached ₹15 L in a single month. No campaign structure, spend or ROAS is supplied, so those are not added.
What Made It Work
- Paid-Social Timing
- Monthly Sales Lift
- Session Volume
- Store-Level Evidence
Key Results
₹43.05 L
Total Sales
3.8 L
Sessions
10.2K
Orders
~₹15 L
Peak Month Noted
Spring 2026
Inflection
Sales rose after paid social was switched on
10.2K
Orders
Store-level order volume
Shopify Store A — Store Snapshot
Store-level totals
The curve changed after the engine went on.
Sales line stuck flat? Let's look at what happens when the paid-social engine goes on.→