

Shopify Store B
Shopify · Store Growth
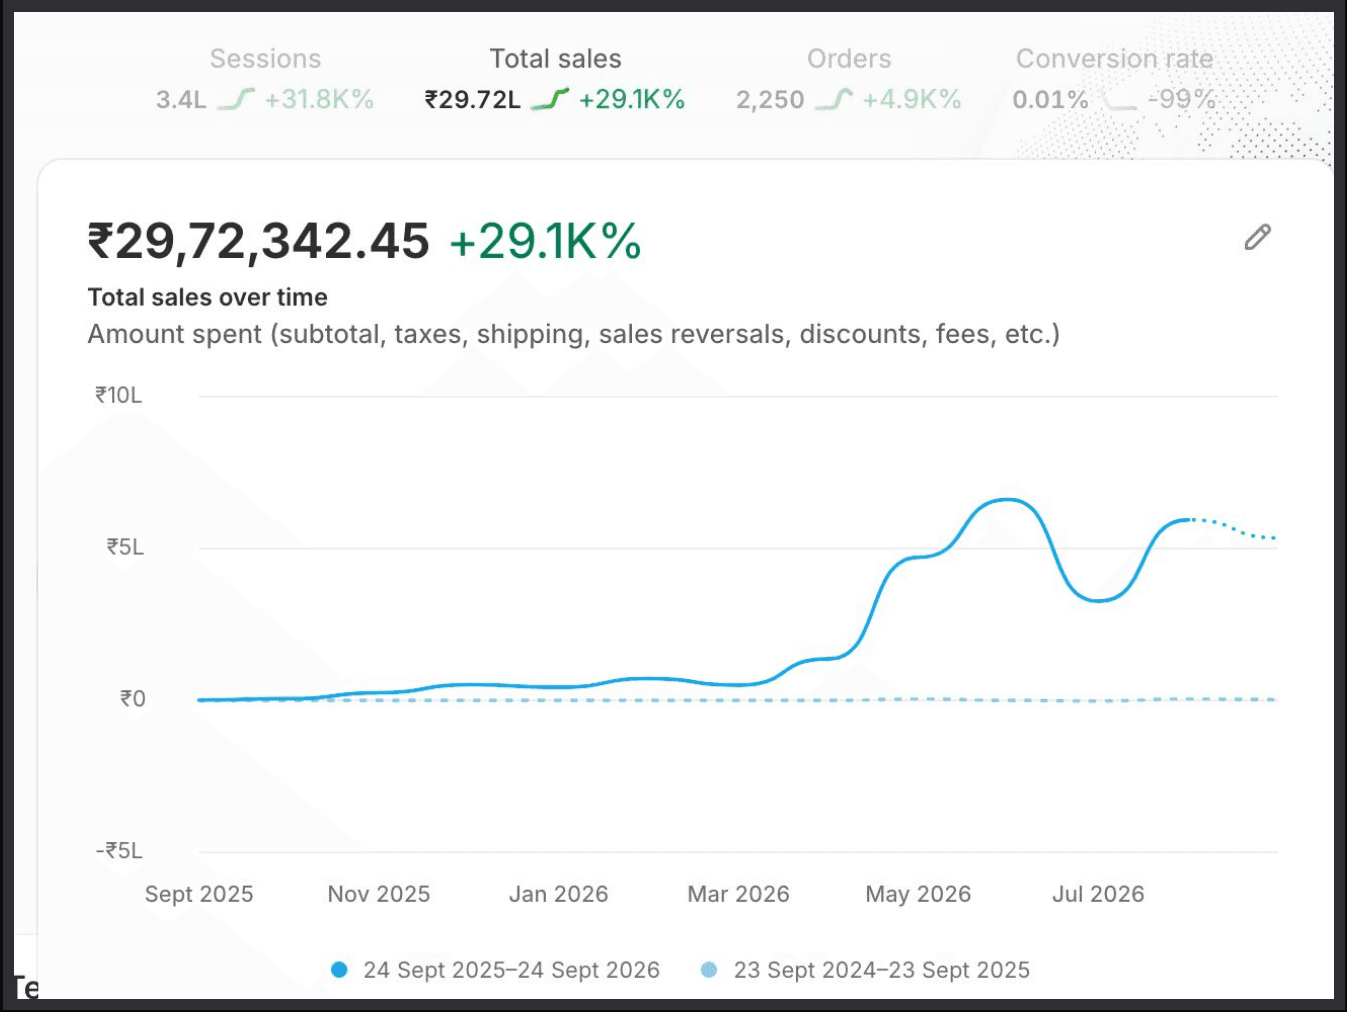
“₹29.72 L in sales — acceleration from spring toward ₹6–7 L months.”
₹29.72 L Total Sales. Built store momentum over the tracked year: ₹29.72 L in sales, 3.4 L sessions and 2,250 orders, with monthly sales moving toward a ₹6–7 L peak after spring.
The Problem
The useful question was not only how much the store sold in total, but how monthly performance changed. A single total can make a store look static; the curve shows when the business began to accelerate.
How We Solved It
The source records growth beginning in the early months of the tracked year and accelerating from spring, with monthly sales moving toward approximately ₹6–7 L. A complete campaign playbook cannot be reconstructed from the sales chart alone.
What Made It Work
- Sales-Curve Tracking
- Spring Acceleration
- Session Volume
- Store-Level Evidence
Key Results
₹29.72 L
Total Sales
3.4 L
Sessions
2,250
Orders
₹6–7 L
Peak Monthly Sales
2,250
Orders
Store-level order volume
Spring
Acceleration
Growth strengthened from spring
Shopify Store B — Store Snapshot
Store-level totals
Momentum over a single spike.
Need the sales curve to accelerate — not just tick along? Let's review the store trend.→