

Shopify Store E
Shopify · Flagship Growth Curve
“₹2.07 Cr. 26.3K orders. A curve that rose quarter after quarter.”
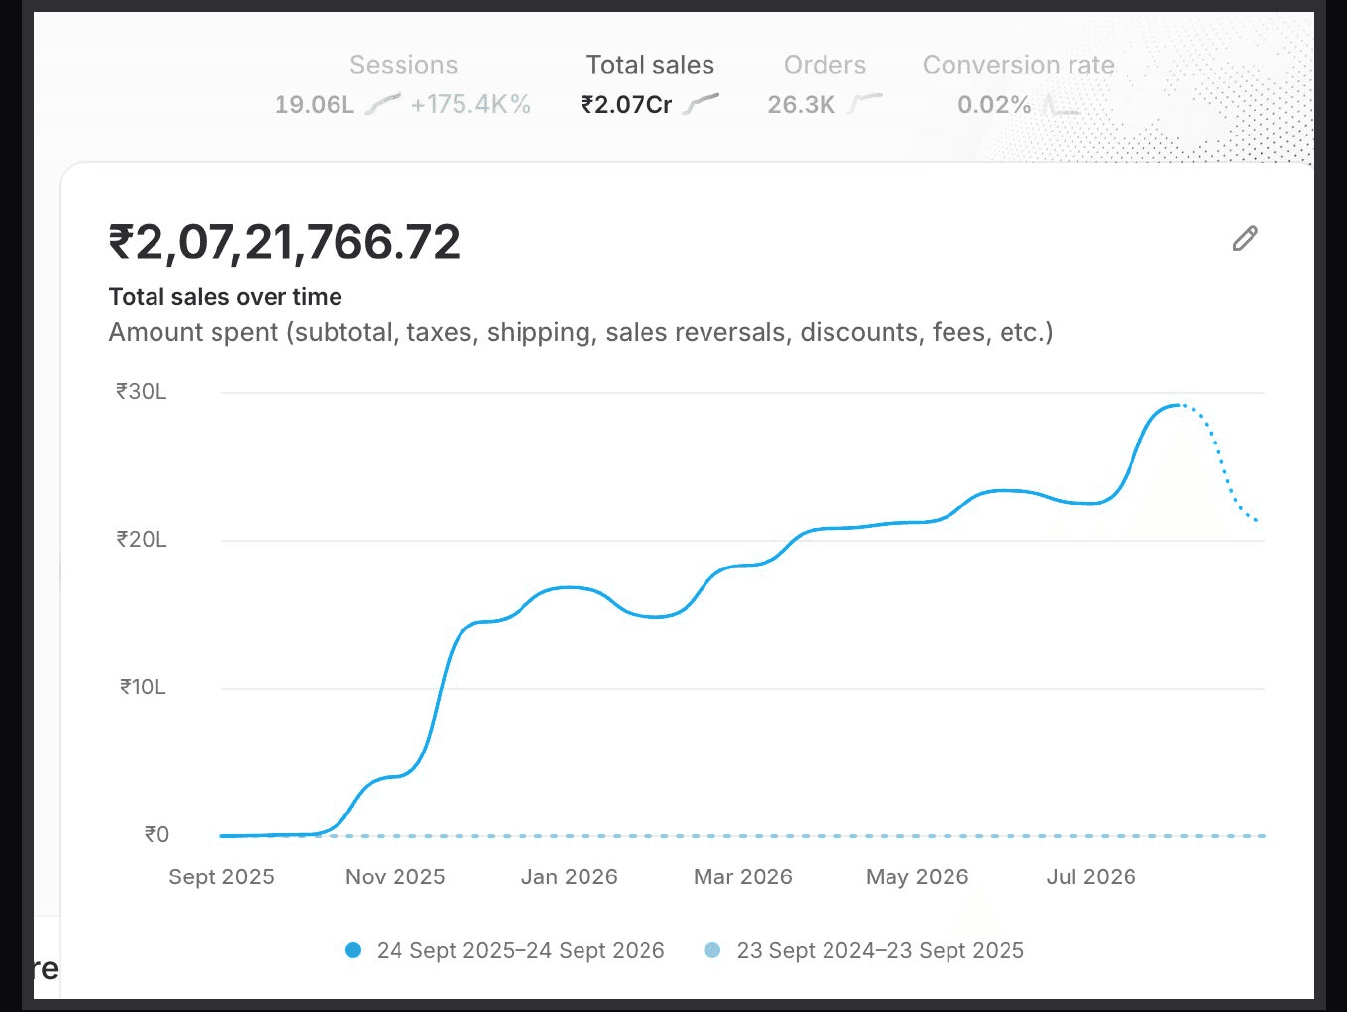
₹2.07 Cr Over the Year. Flagship Shopify growth case: ₹2.07 Cr in sales, 19.06 L sessions and 26.3K orders, with revenue rising from autumn 2025 through following quarters and a monthly peak near ₹30 L.
The Problem
A store may record a strong month and then fall back. This case highlights a different pattern: revenue continuing to rise across successive quarters. Connecting that trend to channels and costs still needs records the source does not include.
How We Solved It
The dashboard trend shows sales beginning to climb in autumn 2025 and continuing through every following quarter, with a monthly peak near ₹30 L. The case is presented as sustained store growth, not an invented campaign sequence.
What Made It Work
- Multi-Quarter Growth
- Store-Level Scale
- Sustained Monthly Rise
- Flagship Curve
Key Results
₹2.07 Cr
Total Sales
19.06 L
Sessions
26.3K
Orders
~₹30 L
Peak Month Noted
19.06 L
Sessions
Store traffic over the tracked year
Autumn 2025
Climb Began
Rose through subsequent quarters
Shopify Store E — Store Snapshot
Store-level totals
A year of compounding, not a spike.
Want a sales line that keeps rising after the first strong month? Let's look at the year, not the spike.→